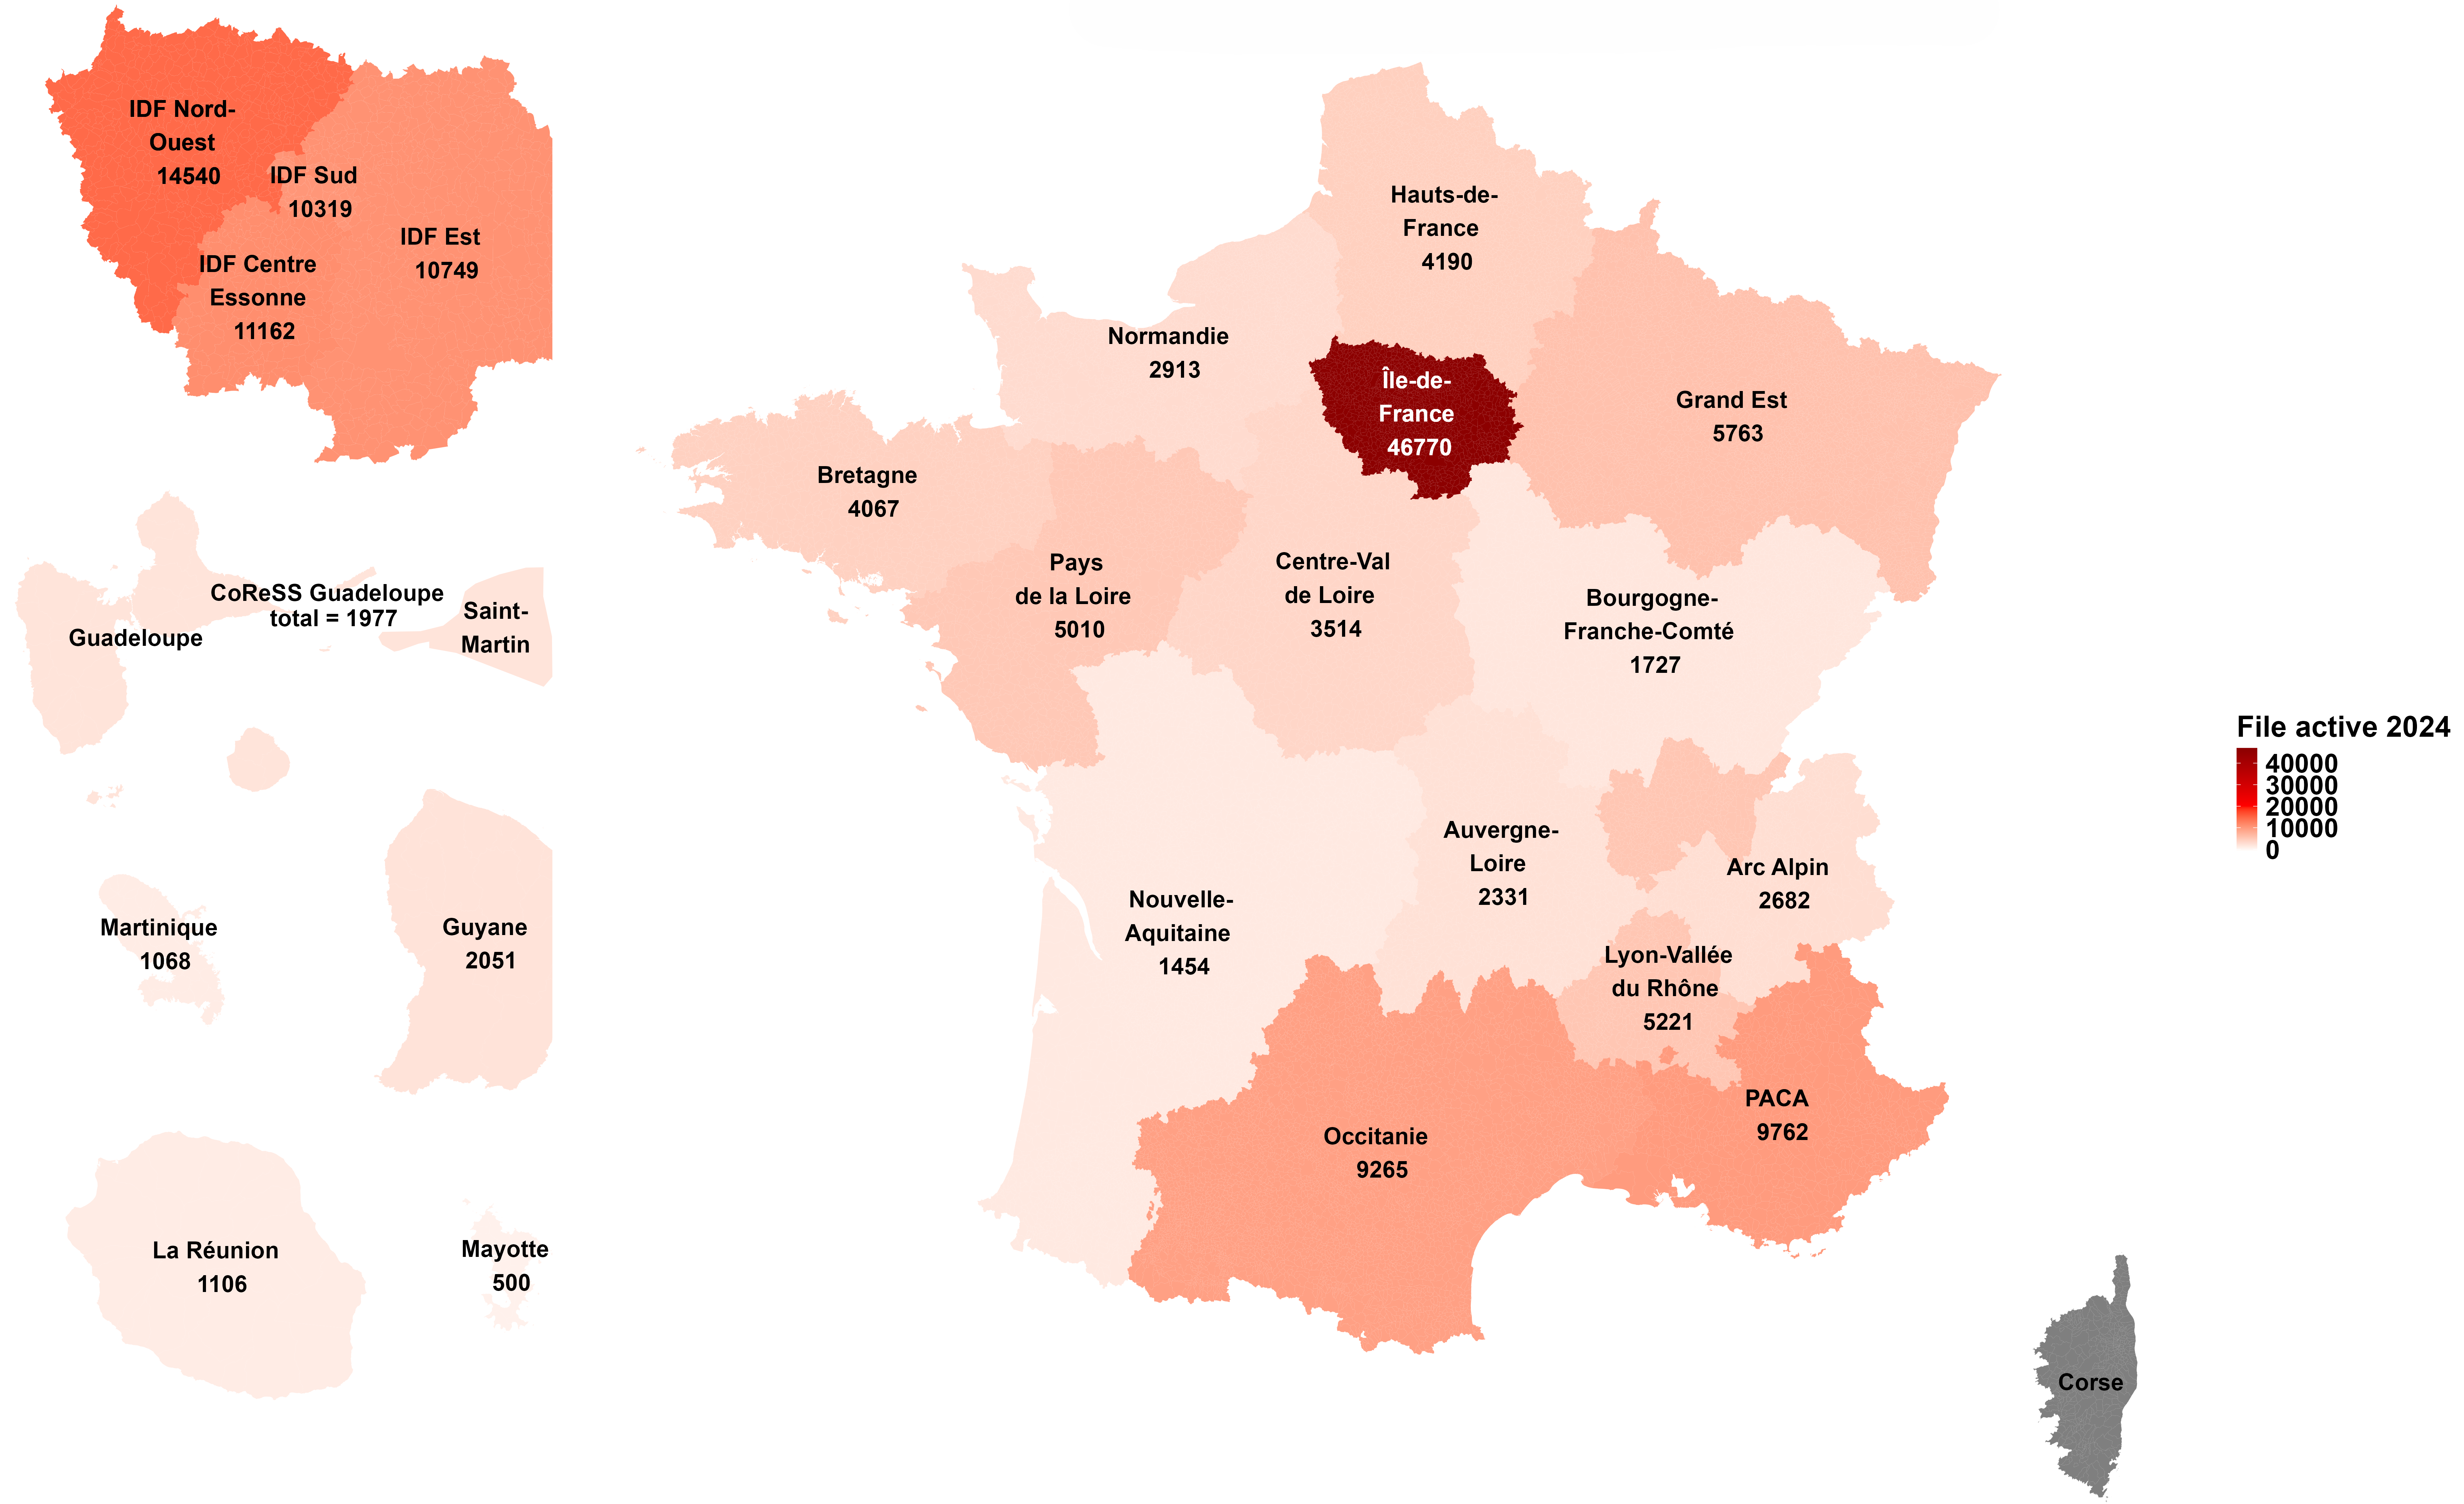
Obtention d’une charge virale < 50 copies/mL à six mois 2020-2024
Line chart. Data table with 6 rows and 2 columns follows.
| Pourcentage | |
|---|---|
| 2020 | 75.9 |
| 2021 | 78.1 |
| 2022 | 77.2 |
| 2023 | 80.8 |
| 2024 | 89.3 |

Line chart. Data table with 6 rows and 2 columns follows.
| Pourcentage | |
|---|---|
| 2020 | 75.9 |
| 2021 | 78.1 |
| 2022 | 77.2 |
| 2023 | 80.8 |
| 2024 | 89.3 |