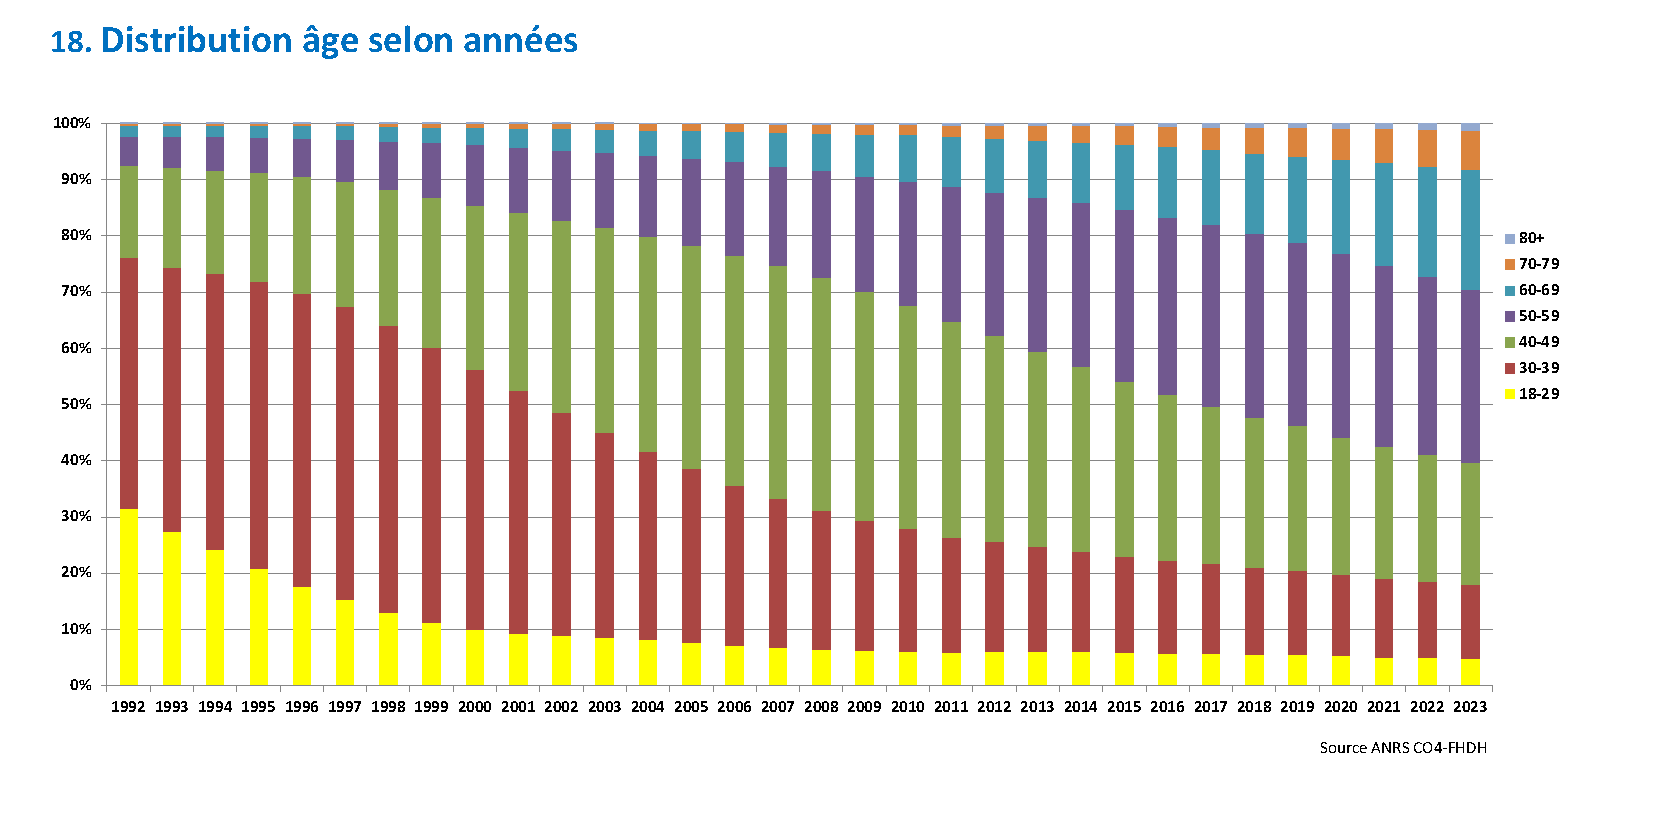
Évolution de l’âge des adultes suivis, France, 2020–2024
Line chart. Data table with 6 rows and 2 columns follows.
| Âge médian | |
|---|---|
| 2020 | 52.5 |
| 2021 | 53.1 |
| 2022 | 53.6 |
| 2023 | 54.1 |
| 2024 | 54.8 |

Line chart. Data table with 6 rows and 2 columns follows.
| Âge médian | |
|---|---|
| 2020 | 52.5 |
| 2021 | 53.1 |
| 2022 | 53.6 |
| 2023 | 54.1 |
| 2024 | 54.8 |